Adaptive TDEE: why your calorie target should change over time
Key points
- A calorie target computed once from a formula goes stale, because your weight, activity and metabolism change.
- An adaptive approach compares what you ate with what your weight trend did, and adjusts the estimate of your energy needs.
- It relies on two things being reasonably honest: your logs and a smoothed weight trend. Single weigh-ins are too noisy.
- It is an estimate, not a measurement, and it is less trustworthy with a few weeks of patchy data.
Most calorie calculators give you a number and stop. That number is a starting guess based on population averages, and it was only ever right for the person you were on the day you typed in your weight. This article explains why targets need to move, and how an adaptive system works out a better figure from your own data.
Why a fixed target goes stale
Your weight changes
The standard predictive equations, such as Mifflin-St Jeor (Mifflin et al., 1990), take your weight as an input. As weight falls, predicted resting energy falls too. NIH researchers modelled this and found that the body's weight response to a change in intake is slow, with half-times of around a year, and that the gap between intake and expenditure closes progressively as weight changes (Hall et al., Lancet 2011). The practical result is that a deficit that works at the start shrinks over time. The same logic works in reverse for people gaining muscle on a surplus.
Your activity changes
Training volume, step count, job and season all change. Many people also move less in unplanned ways when eating less. Activity multipliers in calculators are guesses at best, and they do not update themselves.
Your body adapts
Beyond what weight alone predicts, resting energy use can fall further during and after weight loss, a phenomenon called metabolic or adaptive thermogenesis. In a follow-up of 14 participants from a televised weight-loss competition, researchers at the NIH found that six years later resting metabolic rate was about 704 kcal per day below baseline, and that the part not explained by body composition and age was about 500 kcal per day (Fothergill et al., 2016). This is an unusually extreme group, with very large, rapid weight loss and then regain, so it should not be read as a typical size of effect. It does show that actual expenditure can diverge from formula predictions.
Your cycle may matter a little
A systematic review and meta-analysis of 26 studies involving 318 women found a small but significant increase in resting metabolic rate in the luteal phase of the menstrual cycle (effect size 0.33), with a smaller, non-significant effect in studies published since 2000 (Benton et al., 2020). Individual variation is large. Cycle-related water retention also shifts scale weight by around a kilogram in some people, which is why trend length matters. See our cycle-aware tracking guide.
How the adaptive method works
The idea is simple. If you know how much you ate and how your weight actually changed, you can work backwards to what your body must have been using.
- Log intake for a stretch, typically two to four weeks.
- Smooth the weight data into a trend, so a single high-water morning does not count as fat gain.
- Convert the trend change into energy using an approximate energy value per kilogram of body-weight change. The traditional rule of thumb is about 7,700 kcal per kg (3,500 kcal per pound), which is itself an approximation and is least accurate over long periods (Thomas et al., 2013).
- Estimate expenditure: average daily intake minus the energy implied by the weight change.
A worked example
Suppose over 21 days you log an average of 2,000 kcal per day, and your smoothed weight falls by 0.5 kg.
- Energy implied by weight loss: 0.5 kg x 7,700 = about 3,850 kcal over 21 days, or about 183 kcal per day.
- Estimated expenditure: 2,000 + 183 = about 2,180 kcal per day.
If your formula had said 2,400, the adaptive estimate suggests your real maintenance is lower, and a planned 400 kcal deficit is actually about 180. You would then choose whether to keep going, or to lower the target. Treat the output as one input to a decision, not an order.
Why smoothing weight matters
Day-to-day body weight is noisy. Fluid, salt, carbohydrate stores, digestive contents, and hormonal cycles can each move the scale by a kilogram or more in a day while real fat change is a fraction of that. If a system reacted to each morning's number, it would constantly overreact. A trend line, such as a moving average over a week or more, averages out the noise so the underlying direction is visible. Weigh at a consistent time under consistent conditions, and look at the weekly average, not a single reading.
What can go wrong
- Underlogging. If logs miss 15 percent of intake, the estimated expenditure comes out 15 percent too low. The estimate is only as honest as the food diary. Our photo model overestimates on average in our benchmark, but individual meals can be off either way; see the accuracy page.
- Too little data. Under about two weeks, noise dominates.
- Big changes in water or glycogen. Starting a low-carbohydrate diet or a new training block can move weight in ways that are not fat.
- Medication and medical conditions. Some medicines and conditions affect fluid, appetite and weight. Targets for people with medical conditions should come from their care team.
- Chasing small changes. Smaller than a couple of hundred kilocalories is within noise.
Should you rely on it or on a formula?
Use both. A formula is a reasonable first estimate when you have no data. After a few weeks, your own data is more informative than the population average, as long as it is reasonably complete. For a first calculation see the TDEE calculator and how many calories should I eat. If you want to model weight over time yourself, the NIDDK Body Weight Planner is free. And see calorie deficit explained for why linear predictions fail.
How SnapMacro helps
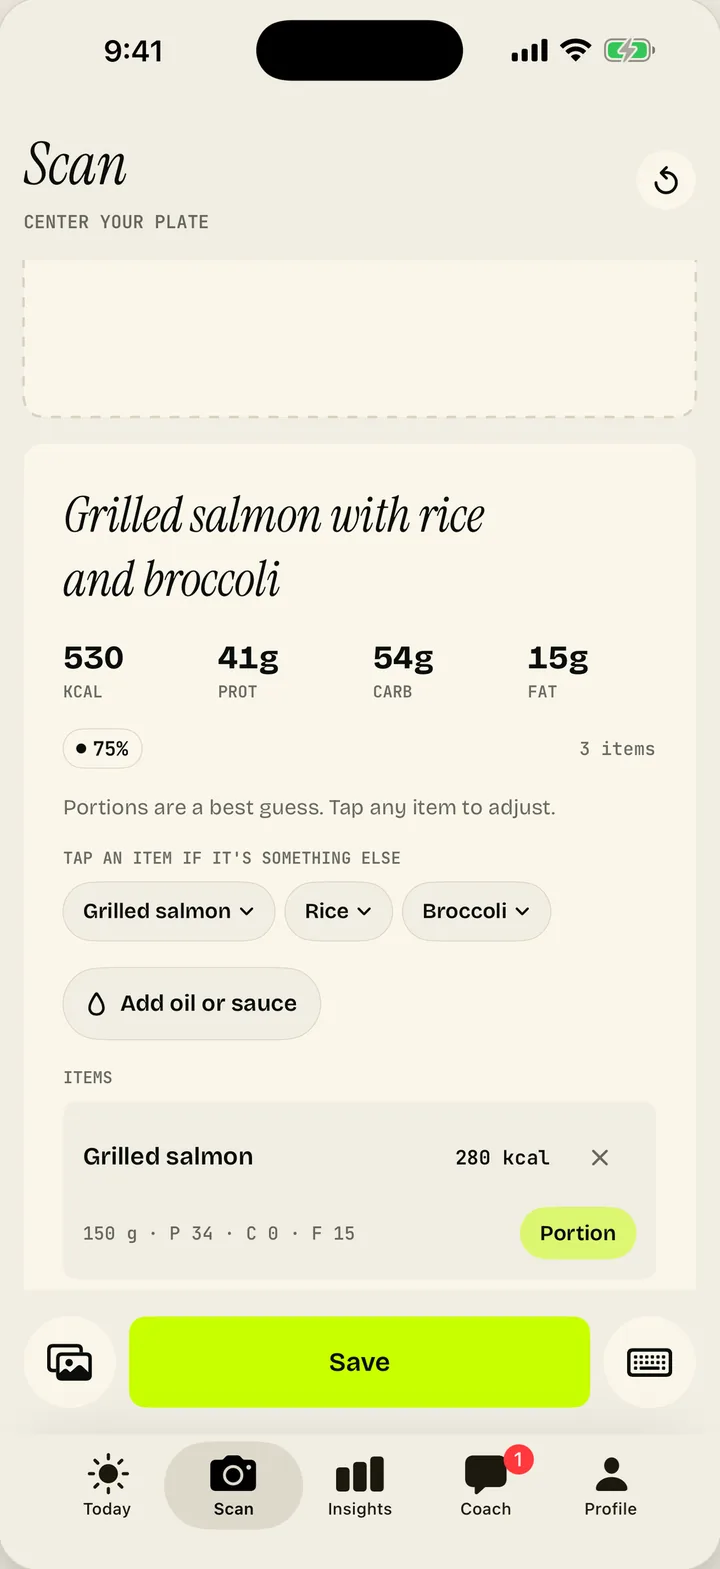
SnapMacro starts from standard formulas and adapts your calorie and macro targets using your logged intake and your real weight trend, with a weekly view that smooths daily swings. Logging is quick by photo, barcode, text or voice, but photo estimates are approximate, so accuracy of the adjustment depends on your logs. Targets are suggestions that you can change.
General information only, not medical advice. SnapMacro is not a medical device.
Sources
- Hall KD, Sacks G, Chandramohan D, et al. Quantification of the effect of energy imbalance on bodyweight. Lancet. 2011;378(9793):826-837. PubMed
- Fothergill E, Guo J, Howard L, et al. Persistent metabolic adaptation 6 years after "The Biggest Loser" competition. Obesity. 2016;24(8):1612-1619. PubMed
- Thomas DM, Martin CK, Lettieri S, et al. Can a weight loss of one pound a week be achieved with a 3500-kcal deficit? Int J Obes. 2013;37(12):1611-1613. PubMed
- Benton MJ, Hutchins AM, Dawes JJ. Effect of menstrual cycle on resting metabolism: a systematic review and meta-analysis. PLoS One. 2020;15(7):e0236025. PubMed
- Mifflin MD, St Jeor ST, Hill LA, et al. A new predictive equation for resting energy expenditure in healthy individuals. Am J Clin Nutr. 1990;51(2):241-247. PubMed
- NIDDK. Body Weight Planner. niddk.nih.gov/bwp
SnapMacro
Skip the counting
Snap a photo of a meal and SnapMacro estimates the calories and macros. Every item is editable, and your targets adapt to your real weight trend.
Download on the App Store